Heatmap
Heatmap
phyloFlash runs from multiple libraries can be compared with a heatmap with
the phyloFlash_heatmap.R script. New users are recommended not to use this
script directly, but to use the wrapper phyloFlash_compare.pl (see
Utilities).
The comparison is based on the counts of how many reads map onto each reference sequence, and the taxonomic affiliation of the reference taken from the SILVA taxonomy string. These are the “NTUs” found under the heading “Read mapping based detected higher taxa” in the standard phyloFlash output.
Libraries will be clustered by their similarity in terms of taxonomic content. Taxa/NTUs will be clustered by their co-occurrence across samples.
Quickstart:
phyloFlash_heatmap.R -h # Show help message
# Run from same folder as phyloFlash output
phyloFlash_heatmap.R -o heatmap.png *.csv
1. Requirements
Requires R and the following packages: optparse, methods, grid,
ggplot2, reshape2, ggdendro, gtable.
The script can also be run within the R environment with
source("/path/to/phyloFlash_heatmap.R"). A short help message will appear
when the script is loaded in the R environment.
2. Basic heatmap
The input to the phyloFlash_heatmap.R script are the .csv outputs from
phyloFlash.pl. You will need the .csv files from at least two runs to perform
the comparison. For simplicity, it is probably easier to copy all the .csv
files that you need into a single folder to run the heatmap analysis.
phyloFlash_heatmap.R -o output.png *.csv
# Alternative: get library names from filenames
phyloFlash_heatmap.R -o output.png --library-name-from-file *.csv
Running this in the test_files folder will yield a heatmap like this:
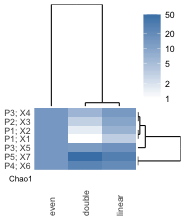
3. How to interpret the heatmap:
- Rows represent taxa, columns represent samples.
- The color scale indicates abundance of taxon by number of reads, scaled as percentages.
- The heatmap is split by taxonomy into Eukaryota and non-Eukaryota.
- Taxonomic diversity of the sample is reported as the Chao1 statistic
- NTUs with counts below 50 are placed together in “Other” by default
4. Changing heatmap options
View the full list of options with the help flag
phyloFlash_heatmap.R -h
Here is an overview of the more commonly-used options
4.1. Changing output appearance
Changes to the appearance of the output figure can be made via the following
options for the phyloFlash_heatmap.R script:
-o FILENAME or --out=FILENAME Choose output filename. Format is either PNG
or PDF, specified by the output filename extensions.
--colors=COLORS Change colors used for heatmap. Options are steelblue,
indianred, green, and orange.
-s HEIGHTXWIDTH or --out-size=HEIGHTXWIDTH Change output image size, the
default is autoXauto
-r ROWS or --rows=ROWS Choose what elements to draw for each row, any
combination of tree, map, chao, and labels, separated by commas
-c COLS or --cols=COLS Choose what elemnts to draw for each column, any
combination of labels, map, tree, separated by commas
-l or --long-taxnames Do not shorten taxa names to only the last two fields
of taxonomy string
4.2. Changing clustering parameters
Clustering parameters for either libraries or taxa can be modified.
-a or --absolute Use absolute values instead of percentages
-n MIN-NTU-COUNT or --min-ntu-count=MIN-NTU-COUNT Change the threshold of
counts per NTU to be included in the category “Other” in the heatmap. Default:
50
-m CLUSTER-SAMPLES or --cluster-samples=CLUSTER-SAMPLES Change the
clustering method used for samples, choose between choose between alpha,
ward, single, complete, average, mcquitty, median or centroid. To
turn off clustering and sort samples alphabetically, choose alhpa. Default:
ward.D
-M CLUSTER-TAXA or --cluster-taxa=CLUSTER-TAXA Change the clustering method
used for taxa, choose between choose between alpha, ward, single,
complete, average, mcquitty, median or centroid. To turn off
clustering and to sort taxa alphabetically, choose alpha. Default: ward.D
--no-split Do not split heatmap
-t SPLIT-REGEX or --split-regex=SPLIT-REGEX Split the heatmap by a regular
expression applied to the taxonomy strings. Default: ‘Eukaryota’
4.3. Further options and known issues
--library-name-from-file Get library/sample names for heatmap from filenames.
Otherwise the script will look into the *report.csv files to find the
corresponding library name
-v or --verbose; -q or --quiet Change the amount of detail in
status/error messages.
-d or --debug Show debug messages - use this if there is a bug and you
would like to submit an error report. The output will help us to diagnose the
problem.
- The clustering may fail if there is only one taxon
- Running the comparison script will only give a first overview of your data: the output is dependent on the accuracy and consistency of the taxonomic annotation of the SILVA database.
- Publication-ready figures will require additional curation, including in most cases a custom database for the organisms being targeted.